


Why Statistical Modeling Matters
Statistical modeling is a crucial component of data science and an essential tool for analyzing and understanding complex data sets, making predictions and informed decisions. It enables us to investigate relationships in data, estimate the likelihood of specific events in the future, test hypotheses and identify patterns.
Here is a short overview of how statistical modeling can support you in data analysis and why it matters.
Understand relationships, identify patterns and trends in the data
Statistical modeling enables us to analyze the relationships between different variables and understand how they are connected. It can also help identify patterns and trends in data sets that may not be immediately apparent. It combines powerful statistical modeling techniques like correlation analysis, regression analysis, time-series analysis and so on to solve a wide range of tasks. For example, it can examine the relationship between income and education, or between age and health outcomes or identify seasonal trends in sales data or patterns of customer behavior.
Testing hypotheses
Hypothesis testing is a process of using statistical methods to determine whether an assumption about a population parameter is supported by the data. Statistical modeling allows us to formulate and test hypotheses, evaluate the significance of our findings and make a conclusion. For example, using statistical models you can test whether a new drug is effective or evaluate the impact of a policy change.
Making predictions
Statistical modeling can be used for making predictions about future events or outcomes by building a model based on past data. Building a model starts with data cleaning and preprocessing, training and choosing the best model, and finally validating it. For example, we can use statistical models to predict the likelihood of a disease outbreak or the performance of a stock market.
Making informed decisions
Summing up, statistical modeling provides the tools to make more informed decisions based on data. We can leverage statistical modeling techniques to reduce uncertainty and improve the accuracy and effectiveness of our decisions. For example, it may support determining the optimal pricing strategy for a product or evaluating the effectiveness of a marketing campaign.
Utilizing Python for statistical modeling has multiple advantages
- It is an open-source programming language, which means that it is free to use.
- It has a large community of practitioners who contribute to its development.
- Python has a rich ecosystem of libraries and tools for statistical modeling, data analysis, and visualization.
Below we will discuss three Python libraries that are commonly used for statistical modeling and check several examples of their utilization.
Library 1: NumPy and Pandas
Overview and Features
NumPy and Pandas are two popular Python libraries that are often used together and provide a wide range of capabilities to support statistical modeling.
Before analyzing the data, it should be prepared: cleaned from errors and duplicates, and restructured. Data quality should also be verified. After data preprocessing you can move on to the calculations.
Pandas has built-in tools for data cleaning and feature engineering, as well as data transformations, while NumPy can be used for further analysis and calculations, for example, scaling and normalization. It is considered to be one of the main Python libraries for data analysis.
Features of the Pandas library
- Allows you to work with huge datasets, including merging and separating them.
- Supports DataFrames, special objects that allow you to analyze data more efficiently by turning it into indexed structured arrays.
- Supports all sorts of data manipulation: recovering and processing missing data, updating and deleting data.
- Visualizes data.
- Accepts data from multiple sources: databases, Excel spreadsheets, and more. Converts data in different formats to those suitable for analysis by the Python language.
Features of the NumPy library
- Supports a variety of data structures that allow for more efficient search, analytics and structuring.
- Can perform complex scientific calculations with mathematical formulas, including data in multidimensional arrays. With NumPy you can multiply, add, align, index arrays, slice them, and reshape.
- Has tools for converting data into different formats.
- Enables working with numeric and other data types.
- Enables linear algebra calculations for complex data analysis in Python.
Integration
Pandas and NumPy are highly complementary libraries that can be used together to perform a wide range of statistical modeling tasks. One of the key data structures of Pandas is the DataFrame, which is a two-dimensional table of data with labeled rows and columns. DataFrames can be easily created from NumPy arrays or loaded from external sources such as CSV files or databases. Once a DataFrame has been created, it can be manipulated and analyzed using Pandas functions and methods, which often rely on NumPy functions under the hood.
NumPy provides low-level, high-performance implementations of mathematical and statistical functions, making it ideal for working with large datasets. Pandas provides high-level abstractions for data manipulation and analysis, making it easy for users to work with data flexibly and efficiently. Combining NumPy and Pandas, users can take advantage of both the high-level abstractions and low-level performance of these libraries.
Examples
- Data preprocessing– Before modeling data should be preprocessed. This may include, for example, missing data imputation, data scaling and standardization as in the next example.
import numpy as np
import pandas as pd

# Create a Pandas DataFrame from a NumPy array
data = np.array([[0.5, 2.0, 3.0], [4.0, 5.0, np.nan], [7.0, 8.0, 9.0]])
df = pd.DataFrame(data, columns=['A', 'B', 'C'])

# Impute missing values using NumPy
df.fillna(df.mean(), inplace=True)

# Scale the data using NumPy
df_scaled = (df - df.mean()) / df.std()
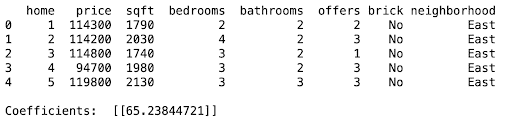
- Linear regression– Linear regression is a common statistical modeling technique for analyzing the relationship between variables. In the next example, we will use Pandas and NumPy to perform linear regression on a dataset of house prices and square footage. This simple model can be further used to predict house price (‘price’) based on its size.
import pandas as pd
import numpy as np

# Load data and show the top 5 rows
df = pd.read_csv('house_prices.csv')
print(df.head())

# Create X and y arrays
X = df['sqft'].values.reshape(-1, 1)
y = df['price'].values.reshape(-1, 1)

# Compute regression coefficients
beta = np.linalg.inv(X.T.dot(X)).dot(X.T).dot(y)

# Print coefficients
print('Coefficients: ', beta)
The output would be:
Library 2: Matplotlib and Seaborn
Overview and features
After preprocessing and analysis, data must be presented in a form that is easy to understand. For this visualization libraries are used.
Matplotlib is a popular Python library for creating high-quality graphs, charts, and plots. It provides a wide range of customization options to create visually appealing plots and is compatible with many operating systems and graphical user interfaces. Matplotlib supports a maximum of various plots and charts.
Seaborn, on the other hand, is a higher-level interface to Matplotlib that provides additional functionality for statistical visualization. It is built on top of Matplotlib and provides an easy-to-use API for creating complex visualizations. Seaborn has built-in support for statistical plots, including linear regression, distribution plots, and categorical plots. It also supports customization options such as color palettes, themes, and styles.
Features of the Matplotlib library
- Allows you to quickly build charts and graphs of various types (line, scatter, column, pie, contour plots and others), and customize their design.
- Supports API for faster integration of graphs into developed applications.
- Knows how to format charts and graphs for easier perception.
Features of the Seaborn library
- Provides tools for exploring and analyzing data before visualization. Enables calculation and visualization of correlations—relationships between different parameters.
- Supports analysis and comparison of different variables as well as building graphs based on this analysis.
- Supports data in various formats.
- Has extensive options for customizing the appearance of charts and creating complex visualizations.
Integration
Since Seaborn is actually built on top of Matplotlib, the two libraries work together seamlessly. One of the main benefits of using Matplotlib and Seaborn together is that you can leverage the strengths of both libraries creating visualizations that are both highly customizable and easy to adjust.
Matplotlib and Seaborn can also be easily integrated with other data science libraries such as NumPy and Pandas.
Examples and tutorials
- Regression analysis
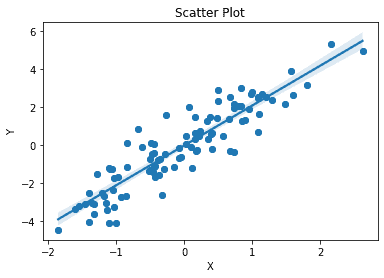
In the first example, we show how to use Matplotlib to create a scatter plot with custom axes labels and a title, and then use Seaborn to add a regression line and confidence intervals.import numpy as np import matplotlib.pyplot as plt import seaborn as sns # Generate some random data x = np.random.randn(100) y = 2*x + np.random.randn(100) # Create a scatter plot with Matplotlib fig, ax = plt.subplots() ax.scatter(x, y) ax.set_xlabel('X') ax.set_ylabel('Y') ax.set_title('Scatter Plot') # Add a regression line and confidence intervals with Seaborn sns.regplot(x=x, y=y, ax=ax)Here is the output:

This kind of visualization allows us to see patterns and relationships in data that might not be obvious from looking at raw numbers. By plotting data points and regression lines, we can see how variables are related and identify outliers or other patterns that may be of interest.
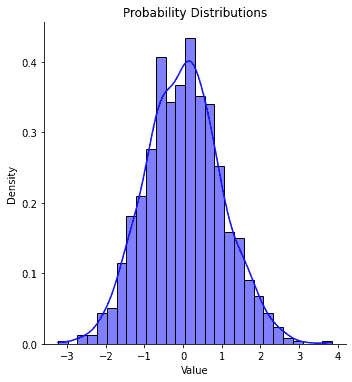
- Distributions visualization with SeabornDistribution plots provide valuable insights into the underlying structure of a dataset. They can help identify important characteristics such as skewness, the presence of outliers and others which can impact the choice of statistical tests and models that are appropriate for analyzing the data.
import seaborn as sns
import numpy as np
import matplotlib.pyplot as plt

# Generate random data for the example
np.random.seed(42)
normal_data = np.random.normal(loc=0, scale=1, size=1000)

# Plot the distributions using Seaborn
sns.displot(normal_data, kde=True, stat="density", color="blue")

# Set the plot title and labels
plt.title("Probability Distributions")
plt.xlabel("Value")
plt.ylabel("Density")

# Show the plot
plt.show()
In the example below we produce a plot for the probability distribution for the normally distributed random data.
And the output:

Library 3: Statsmodels
Overview and features
Python has not so many built-in tools developed specifically for statistical analysis, which is inferior to some other languages for data analysis, such as R. The Statsmodels library corrects this shortcoming. It is a Python library for estimating statistical models and performing statistical tests, including linear regression, time-series analysis, and hypothesis testing. It combines the graphics capabilities of Matplotlib, Pandas data preparation tools, and the mathematical functionality of NumPy and SciPy. In fact, Statsmodels is built on top of NumPy, SciPy, and Matplotlib, but contains more advanced functions for statistical modeling. It also allows you to implement formulas from the R language.
Features of the Statsmodels library
- Is suitable for complex calculations and statistical models including generalized linear and Bayesian models.
- Allows you to build generalized models and run statistical tests.
- Allows those who have experience in R to work more efficiently in Python, as it supports many methods from this language.
- Has good compatibility with other Python libraries and tools.
Integration
Statsmodels is built on top of other popular Python libraries like NumPy, Pandas, and Matplotlib. It also integrates well with other scientific computing libraries like SciPy and Scikit-learn.
Examples and tutorials
Statsmodels provides a wide range of statistical models for different types of data analysis. We will examine how to build logistic regression using this library. Statsmodels provides an extensive set of tutorials and documentation (https://www.statsmodels.org/stable/gettingstarted.html) where further examples can be found.
Logistic regression is a popular method used for binary classification problems. In the following example, we use it to predict survival probability for a publicly available Titanic dataset.
import statsmodels.api as sm
import pandas as pd

# Load the titanic dataset
data = sm.datasets.get_rdataset("TitanicSurvival", "carData").data

# Convert the variables to appropriate data types
data['survived'] = data['survived'].astype('category')
data['passengerClass'] = data['passengerClass'].astype('category')
data['sex'] = data['sex'].astype('category')
data['age'] = data['age'].astype(float)

# Create a binary variable for whether the passenger is a child (age < 18)
data['child'] = data['age'] < 18
data['child'] = data['child'].astype(int)

# Fit the logistic regression model
model = sm.formula.glm(
    formula='survived ~ sex + age + passengerClass + child',
    data=data,
    family=sm.families.Binomial()
).fit()

# Print the summary of the model
print(model.summary())
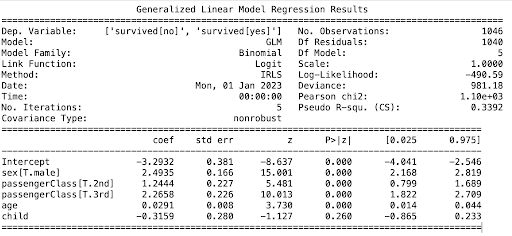
In the end, we print the summary of the model which provides us with important information, including the coefficients of the model and their significance, as well as various goodness-of-fit statistics.
Here is the output:
Besides the libraries we mentioned in this article, some others can be beneficial depending on a problem you would like to solve. Among them are SciPy, Scikit-learn and PyMC3. These libraries can be used together to perform a wide range of statistical modeling tasks, from basic data analysis to advanced machine learning and Bayesian modeling. By leveraging the power of these libraries, Python has become a popular language for statistical modeling and data analysis.
Here are some references to learn more about utilizing Python for statistics:
- “Python Data Science Handbook” by Jake VanderPlas – provides a comprehensive introduction to data science in Python, including statistical modeling with Pandas, Numpy, and Scikit-learn.
- “Introduction to Statistical Learning” by Gareth James et al. – covers the basics of statistical modeling and machine learning in Python, with examples using Scikit-learn and Statsmodels.
- “Python for Data Analysis” by Wes McKinney – focuses on data manipulation and analysis with Pandas, including topics such as data cleaning, data wrangling, and statistical modeling.
- https://scikit-learn.org/stable/user_guide.html
- https://www.statsmodels.org/stable/gettingstarted.html